Vale the growth in static site generators
August 27, 2015
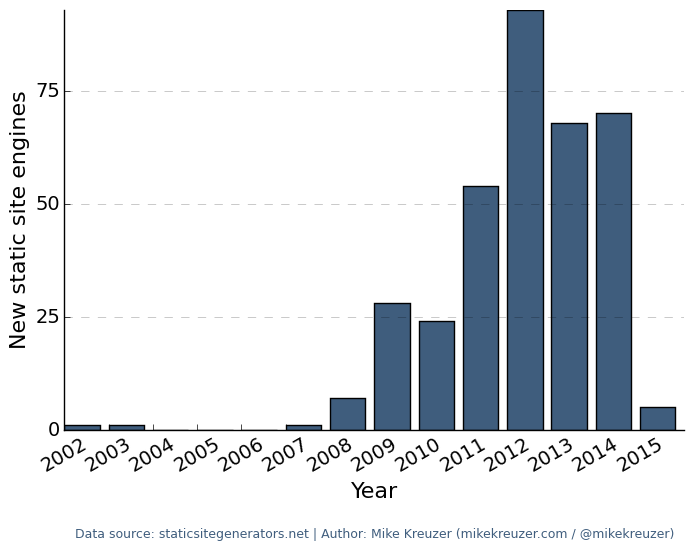
It's interesting to see the market for a free good (open source static site generators in this case) get flooded. When I wrote about using them as a proxy for languages people were interested in trying out back in December I assumed that bubble wasn't about to burst any time soon. Ain't it always the way.
Any potential users still in the market for a static site generator are as spoilt for choice as they're ever likely to get, and people seem to be picking the engine with the most stars that's written in their language of choice. That's a happy enough feedback mechanism for what are mostly good pieces of work, but one that means any adventurous souls with the desire to roll their own new engines will have very little incentive to publish. Frankly there's probably little enough need for them to, whatever innovation there was to be had in what is after all a reasonably straightforward problem domain seems to have been tapped out a while back.
Writing a static blog engine is still an interesting enough side project, it became my go to test when kicking the tyres on any new programming language, and there are certainly plenty of existing examples to learn from, but as the Twitter joke would have it:
All of these folks reinventing frontend JavaScript frameworks have really cut down on the pace of innovation in static site generators.
— Dan Callahan (@callahad) August 5, 2015Node, node, node
It took me six months to get over my recent infatuation with Node, for the moment at least. I don't intend to bag it here, because as horrible as JavaScript can be, and boy can it be horrible, both JavaScript for Animation (JXA) and JavaScriptCore for embedding will mean that I'll still be writing it for a while yet. When I have to.
Python, for the Zen of it
Beautiful is better than ugly. Readability counts. Python's grown on me. I turned down a job once years ago because it mostly consisted of writing Python code (also the pay was lousy) but life is full of little ironies. This might be a thing now, this Python thing.
Swift and Python are a nice match. More on that later probably, but for now, speaking of what must surely be well trodden ground, the code used to generate that graph, with something like a first stab at a wrapper function for some matplotlib functions…
Update 15 September 2018: I removed the embedded gist that was here, the gist of course is still available.
Update November 2023: Here it is again, as I leave Github:
"""Chart the decline in new static blog engines,
data via https://staticsitegenerators.net"""
import json
import matplotlib.pyplot as plt
import time

def file_to_list(file_name):
    """Load the data from the json file"""
    with open(file_name, 'r') as file_handle:
        data_string = file_handle.read()
        data_list = json.loads(data_string)
        return data_list


def count_by_year(engine_list):
    """Tally yearly totals, assumes sorted data, data can have gaps"""
    totals = {}
    for engine in engine_list:
        if engine['created_at'] is not None:
            year = int(time.strptime(engine['created_at'], "%Y-%m-%dT%H:%M:%SZ")[0])
            if year in totals:
                totals[year] = totals[year] + 1
            else:
                totals[year] = 1
    return totals


def draw_chart(sparse_data, x_label, y_label, source_text, show=False):
    """matplotlib wrapper, data is sorted but can have gaps, styling ideas thanks to
    http://www.randalolson.com/2014/06/28/how-to-make-beautiful-data-visualizations-in-python-with-matplotlib/"""
    keys = list(sparse_data.keys())
    first_key = keys[0]
    last_key = keys[len(keys) - 1]
    period = range(first_key, last_key + 1)
    period_plus_one = range(first_key, last_key + 2)

    data = {}
    for year in period:
        if year not in sparse_data:
            data[year] = 0
        else:
            data[year] = sparse_data[year]

    fig, axes = plt.subplots()
    fig.figsize = (10, 7.5)
    fig.subplots_adjust(bottom=0.2)
    fig.frameon = False
    axes.spines['right'].set_visible(False)
    axes.spines['top'].set_visible(False)

    axes.xaxis.set_ticks_position('bottom')
    axes.yaxis.set_ticks_position('left')
    plt.xticks(period, fontsize=14)
    plt.xticks(rotation=30)
    plt.yticks(range(0, 100, 25), fontsize=14)
    plt.xlabel(x_label, fontsize=16)
    plt.ylabel(y_label, fontsize=16)

    for y_val in range(0, 100, 25):
        plt.plot(period_plus_one, [y_val] * len(period_plus_one), "--", lw=0.5,
                 color="black", alpha=0.3)

    plt.bar(period, list(data.values()), 0.8, color="#3F5D7D")
    # or eg plt.plot(period, list(data.values()), '-', color="#3F5D7D", markersize=10)

    plt.text(first_key + 0.25, -24, "Data source: {} | "
             "Author: Mike Kreuzer (mikekreuzer.com / @mikekreuzer)".format(source_text),
             fontsize=9, color="#3F5D7D")
    plt.savefig("chart.png", bbox_inches="tight")
    if show:
        plt.show()


TOTALS_BY_YEAR = count_by_year(file_to_list('static_sites_24AUG15.json'))
draw_chart(TOTALS_BY_YEAR, "Year", "New static site engines", "staticsitegenerators.net")